
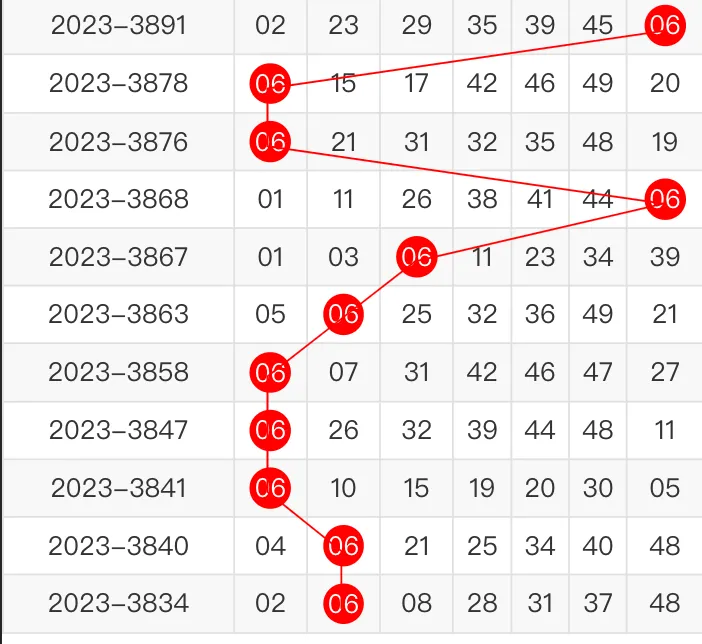
效果
我们先来看一下要实现的效果:
原理
渲染页面的时候把需要连线的点加上“标记”类名,然后再把这些带有标记的元素用线段连接起来。
数据
const data = ref([
  {
    p: '2023-01',
    list: [
      { num: 10, active: 0 },
      { num: 2, active: 0 },
      { num: 14, active: 1 },
      { num: 33, active: 0 },
      { num: 11, active: 0 },
      { num: 14, active: 0 },
      { num: 18, active: 0 }
    ]
  },
  {
    p: '2023-02',
    list: [
      { num: 10, active: 0 },
      { num: 2, active: 0 },
      { num: 14, active: 0 },
      { num: 33, active: 0 },
      { num: 11, active: 1 },
      { num: 14, active: 0 },
      { num: 18, active: 0 }
    ]
  },
  {
    p: '2023-03',
    list: [
      { num: 12, active: 1 },
      { num: 20, active: 0 },
      { num: 17, active: 0 },
      { num: 23, active: 0 },
      { num: 17, active: 0 },
      { num: 14, active: 0 },
      { num: 18, active: 0 }
    ]
  },
  {
    p: '2023-04',
    list: [
      { num: 12, active: 0 },
      { num: 20, active: 0 },
      { num: 17, active: 0 },
      { num: 23, active: 0 },
      { num: 17, active: 0 },
      { num: 14, active: 1 },
      { num: 18, active: 0 }
    ]
  }
  //...更多数据
])
页面
<div class="table-wrap">
      <table>
        <tr style="line-height: 28px; vertical-align: middle">
          <th>期号</th>
          <th>正一</th>
          <th>正二</th>
          <th>正三</th>
          <th>正四</th>
          <th>正五</th>
          <th>正六</th>
          <th>特码</th>
        </tr>
        <tr v-for="item in data" :key="item">
          <td>
            <div>{{ item.p }}</div>
          </td>
          <td v-for="(childItem, index) in item.list" :key="index">
            <div :class="childItem.active === 1 ? 'lableNum' : ''">{{ childItem.num }}</div>
          </td>
        </tr>
      </table>
    </div>

    <style lang="scss">
    .table-wrap {
        .lableNum {
              background-color: #ff0000;
              position: relative;
              border-radius: 50%;
              color: #fff !important;
              width: 22px;
              height: 22px;
              line-height: 22px !important;
              left: 50%;
              transform: translate(-50%, -0%);
              font-size: 15px;
        }
        table {
          width: 100%;
          background: #fff;
          //margin-top: 0.12rem;
          border-collapse: collapse;
          text-align: center;
          tr {
            line-height: 28px;
          }
          th {
            font-weight: normal;
            background: #a96223;
            color: #ffffff;
            border: 0.5px solid #b77a45;
          }
          tr:nth-of-type(2n) {
            background: #f8f8f8;
          }
          td {
            border: 0.5px solid #e1e1e1;
            font-size: 13px;
          }
          .red {
            width: 24px;
            height: 24px;
            color: #fff;
            background: red;
            border-radius: 50%;
            text-align: center;
            line-height: 24px;
            margin: 0 auto;
          }
        }
  }
    </style>
创建连线(画线方法)
封装画线函数
// fn.ts
//画线函数
export const fnLineChart = function (eleDots: any) {
  eleDots.forEach((ele: any, index: number) => {
    const eleNext: any = eleDots[index - 1]
    if (!eleNext) {
      return
    }
    let eleLine = ele.querySelector('i')

    if (!eleLine) {
      eleLine = document.createElement('i')
      eleLine.className = 'line'
      ele.appendChild(eleLine)
    }
    // 记录坐标
    const boundThis = ele.getBoundingClientRect()
    // 下一个点的坐标
    const boundNext = eleNext.getBoundingClientRect()
    // 计算长度和旋转角度
    const x1 = boundThis.left,
      y1 = boundThis.top
    const x2 = boundNext.left,
      y2 = boundNext.top
    // 长度
    const distance = Math.sqrt((x2 - x1) * (x2 - x1) + (y2 - y1) * (y2 - y1))
    // 弧度
    const radius = Math.atan2(y2 - y1, x2 - x1)
    // 设置线条样式
    eleLine.style.width = distance + 'px'
    eleLine.style.transform = `rotate(${radius}rad)`
    eleLine.style.position = 'absolute'
    eleLine.style.left = '50%'
    eleLine.style.top = '50%'
    eleLine.style.height = '1px'
    eleLine.style.boxSizing = 'border-box'
    eleLine.style.background = '#FF0000'
    eleLine.style.transformOrigin = 'left center'
    eleLine.style.marginTop = '-1px'
    eleLine.style.pointerEvents = 'none'
    eleLine.style.zindex = '-1'
  })
以上函数接受一个包含坐标信息的数组作为参数,主要功能是根据传入的坐标信息,计算出线条的长度和旋转角度,并将线条样式应用到相应的元素上。
首先通过遍历传入的坐标数组,获取当前点和下一个点的坐标信息。然后,通过使用两点之间的坐标差值,计算出线条的长度和旋转角度。
接下来,创建一个<i>元素,并将其添加到当前点所在的元素中。如果当前点已经存在<i>元素,则直接使用已有的<i>元素。
然后,设置线条样式。首先,计算线条的宽度,即两点之间的距离。然后,根据旋转角度,设置线条的旋转角度。接着,设置线条的位置、高度、背景颜色等样式属性。
最后,将线条元素的一些特殊样式属性设置为绝对定位和层级为-1,以确保线条位于其他元素之后。
使用了一些数学计算和DOM操作,实现了根据坐标信息绘制线条的功能。
使用函数
import { fnLineChart } from '@/utils/fn.ts'
nextTick(() => {
  let eleDots = document.querySelectorAll('.lableNum')
  console.log(eleDots)
  fnLineChart(eleDots)
})
在回调函数中,首先使用document.querySelectorAll方法获取所有类名为.lableNum的元素,并将其保存在eleDots变量中。
最后,调用fnLineChart函数,并将eleDots作为参数传入。这个函数用于绘制线条图,将传入的元素集合作为参数,根据元素的坐标信息绘制相应的线条。
通过将代码放入nextTick回调函数中,可以确保在下一个DOM更新周期中执行代码,这样可以避免在数据更新后立即执行DOM操作,从而提高性能和避免可能的错误。
参考的文章:https://blog.csdn.net/weixin_45461674/article/details/119410694?spm=1001.2014.3001.5501


评论(0)